

Ferrostatin 1 (Fer-1)
Ferrostatin-1 (Fer-1) is a potent inhibitor of ferroptosis, a type of iron-dependent cell death implicated in various kidney diseases, including hyperuricemic nephropathy (HN). HN is a metabolic disorder characterized by elevated uric acid levels, leading to renal fibrosis and tubular necrosis. It reduces serum uric acid, serum creatinine, and blood urea nitrogen levels, increases uric acid excretion in urine, ameliorates renal tubule dilatation and reduces renal collagen deposition, upregulates expression of ferroptosis-associated molecules (SLC7A11, GPX4, FTL-1, and FTH-1) and exhibits dose-dependent inhibition of URAT1, with an IC50 value of 7.37 ± 0.66 μM. According to our research Ferrostatin-1 offers a promising therapeutic strategy for hyperuricemic nephropathy, addressing the limitations of current urate-lowering therapies by suppressing ferroptosis.
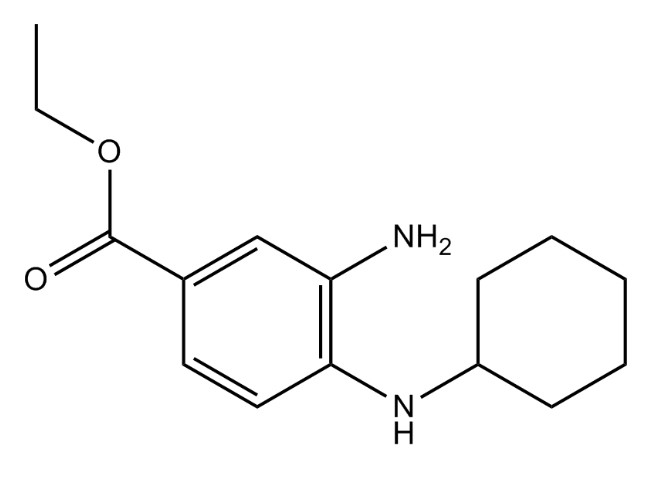
Fig.1. chemical structure of Ferrostatin 1
Ferroptosis Contributes to Kidney Injury in Hyperuricemic Nephropathy (HN): In a mouse model of HN, significant kidney damage was observed, characterized by elevated serum uric acid, creatinine, and blood urea nitrogen levels, and renal tubular dilation. Iron concentration and lipid peroxidation increased, while antioxidant levels decreased. Notably, ferroptosis-related molecules (GPX4, SLC7A11) and iron metabolism proteins (FTL-1, FTH-1) were downregulated in HN mice, indicating ferroptosis contributes to kidney injury as shown in Fig 2.
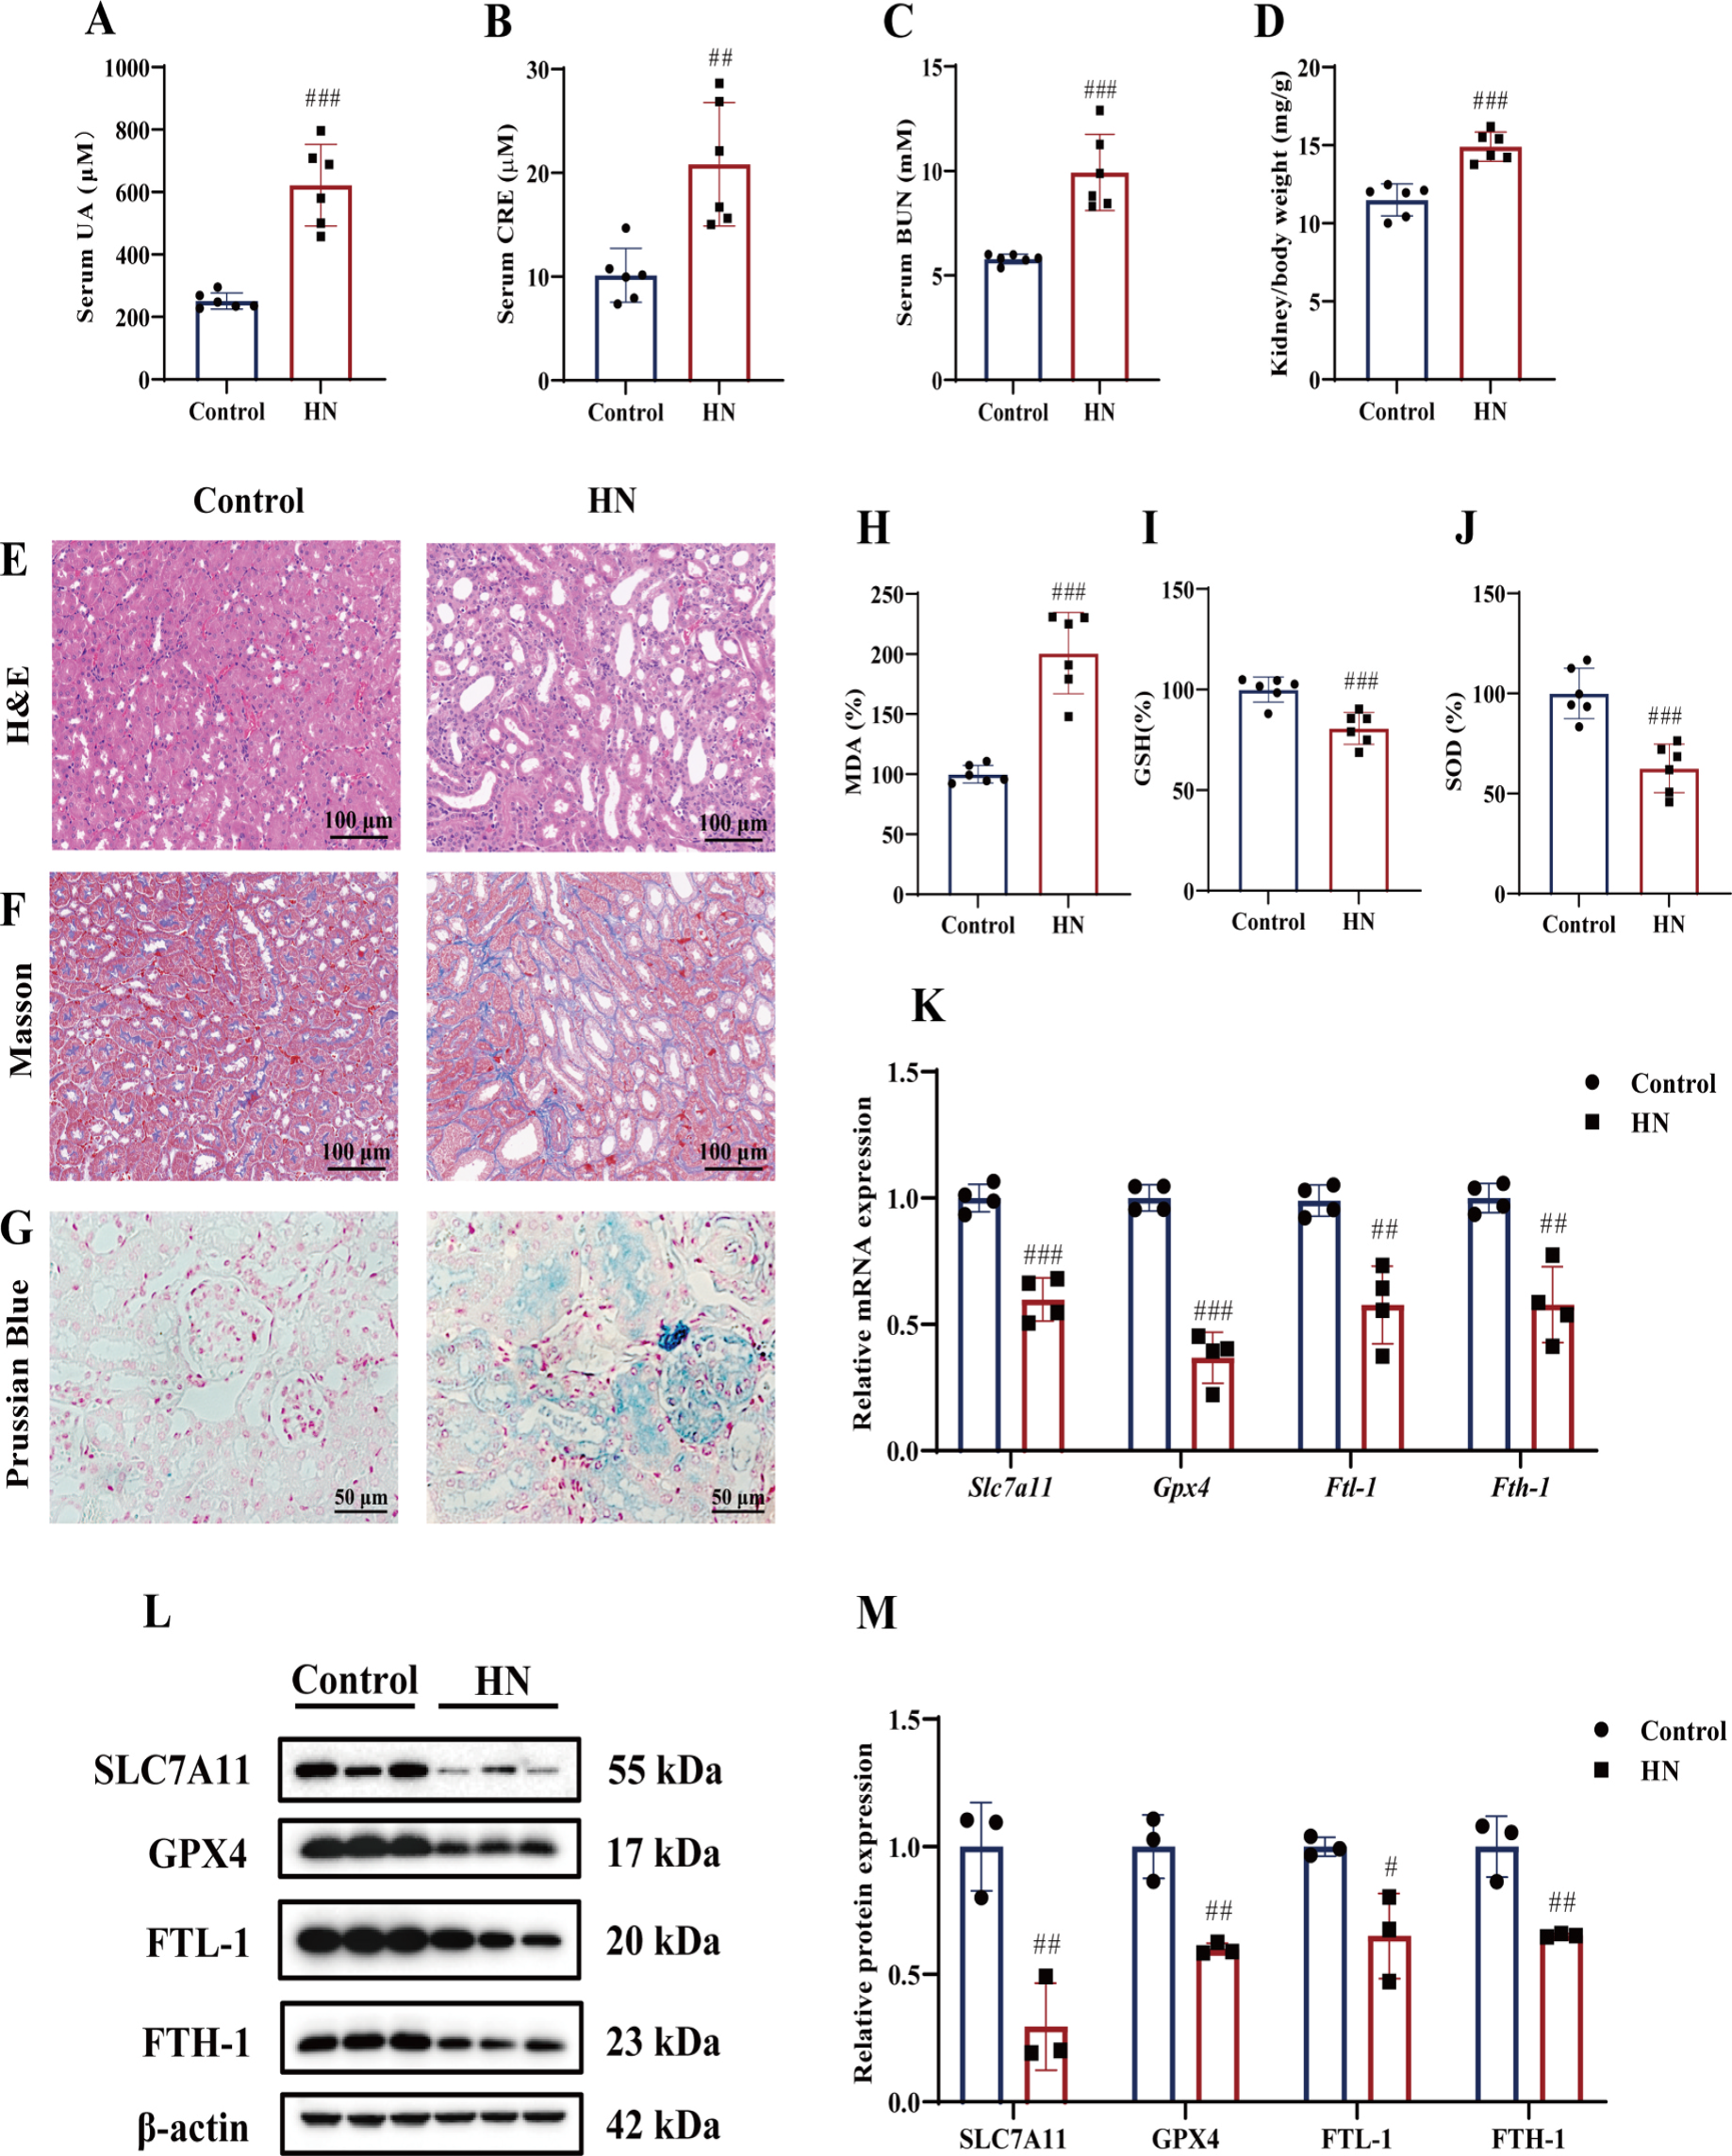
Fig.2. Ferroptosis-related changes occurred in the kidney of mice with HN. (A) Serum UA levels. (B) Serum CRE levels. (C) Serum BUN levels. (D) Kidney/body weight. (E&F) Representative H&E staining and Masson staining of kidney tissues. Scale bar = 100 μm. (G) Prussian Blue staining of kidney tissues. Scale bar = 50 μm. The levels of MDA (H), GSH (I) and SOD activity (J) in kidney tissues. A-J, n = 6 per group. (K) Relative mRNA levels of kidney tissue Slc7a11, Gpx4, Ftl-1 and Fth-1 (n = 4 per group). (L&M) Immunoblots and the relative protein expression levels of SLC7A11, GPX4, FTL-1 and FTH-1 in kidney tissues .
Ferrostatin-1 (Fer-1) Ameliorates HN-Induced Renal Damage: Fer-1, a ferroptosis inhibitor, was administered to HN mice (Fig. 3A). Treatment with Fer-1 mitigated kidney lesions (Fig. 3B), reduced serum uric acid, creatinine, and blood urea nitrogen levels (Fig. 3C-E), and increased urine uric acid excretion (Fig. 3F). Fer-1 also decreased tubular necrosis and swelling (Fig. 3G-H) and regulated tubular damage markers, including Kim-1, NGAL, and Klotho (Fig. 3H-K). These results demonstrate that Fer-1 improves renal function and alleviates pathological damage in HN mice by inhibiting ferroptosis.
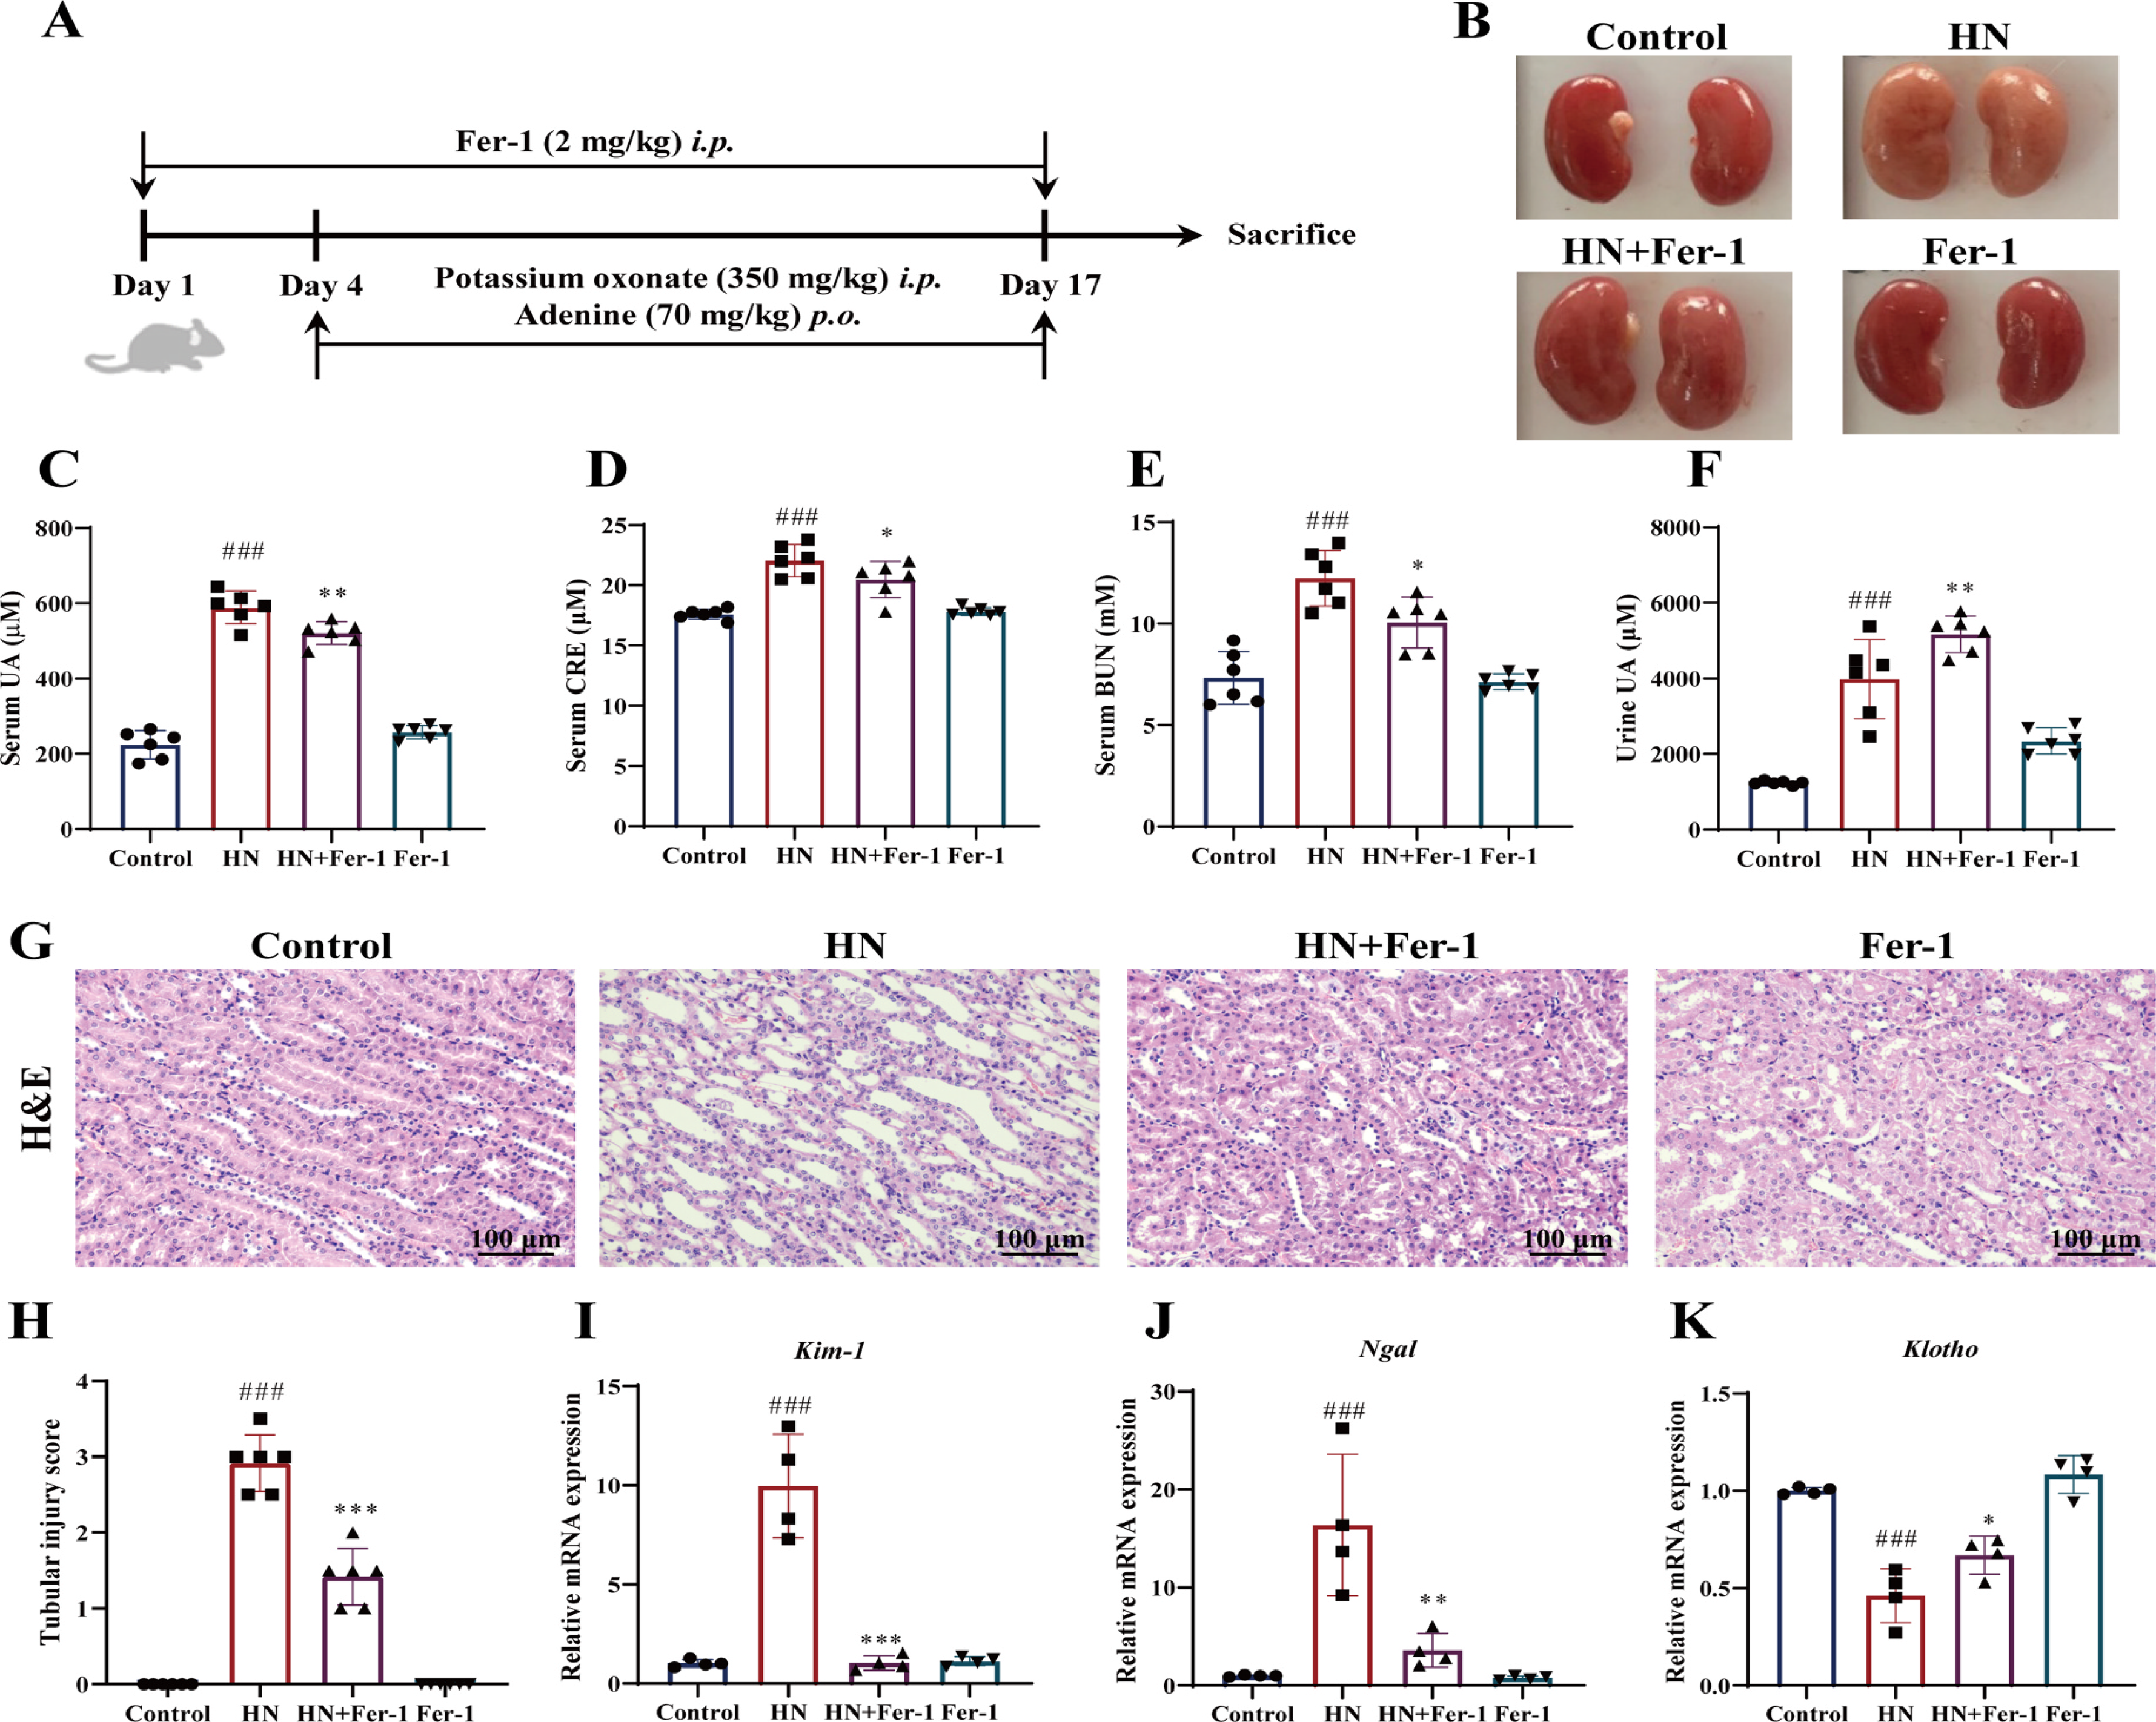
Fig. 3. Effect of Fer-1 on the renal pathological changes in mice with HN. (A) The experiment schematic of Fer-1 treatment. (B) Representative appearance of the kidneys. (C) Serum UA levels. (D) Serum CRE levels. (E) Serum BUN levels. (F) Urine UA levels. (G&H) Representative photomicrographs of H&E staining and the semiquantitative scoring of the tubular injury in kidney tissues. Scale bar = 100 μm. C–H, n = 6 per group. (I–K) Relative mRNA levels of kidney tissue Kim-1, Ngal, and Klotho .
Ferrostatin-1 (Fer-1) Attenuates Renal Fibrosis in Hyperuricemic Nephropathy (HN) Mice: Fer-1 treatment reduced renal fibrosis in HN mice, as evidenced by decreased blue staining in Masson's trichrome staining (Fig. 4A&B). Fer-1 also regulated fibrogenesis-related factors, decreasing Collagen I and Fibronectin expression while increasing E-cadherin (Fig. 4C-E). These results indicate that Fer-1 improves renal fibrosis in HN mice by inhibiting ferroptosis.
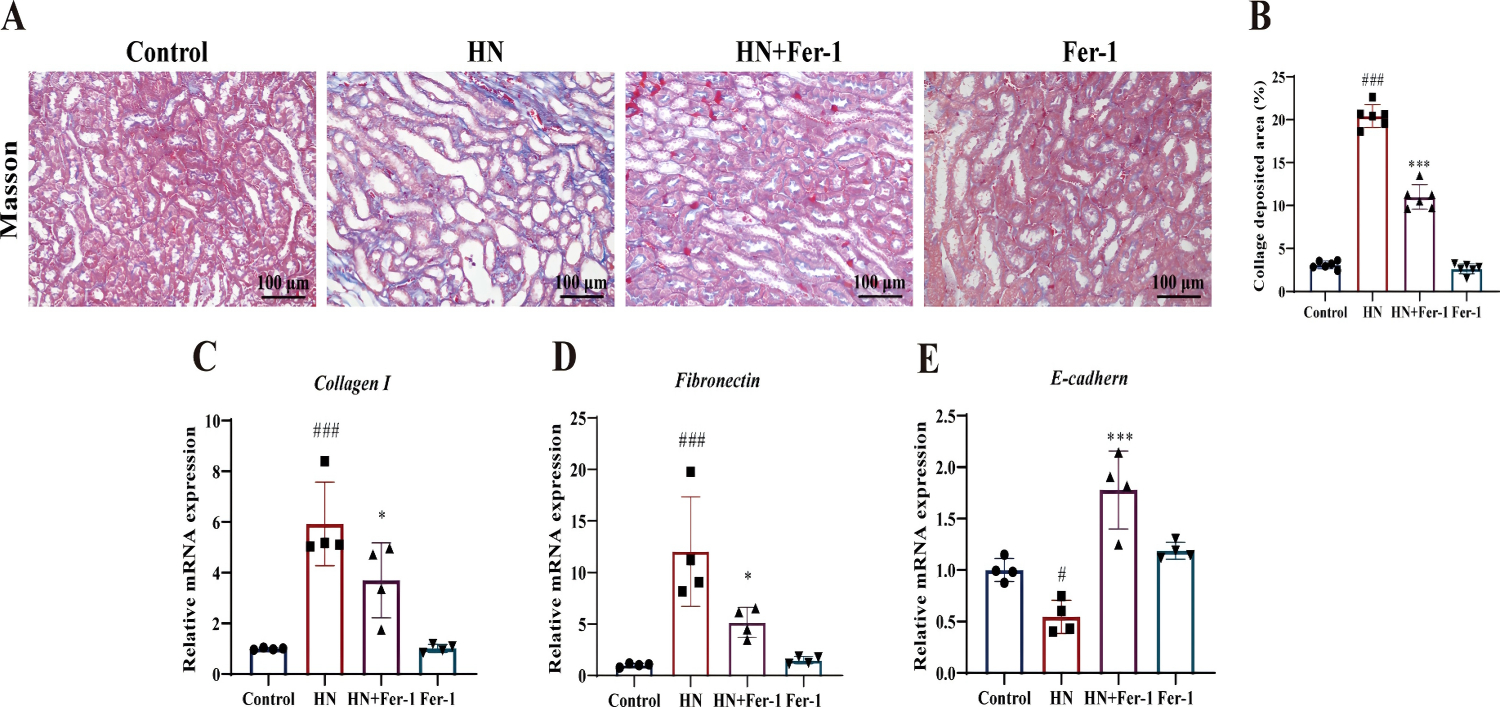
Fig. 4. Shows the Effect of Fer-1 on the renal fibrosis in mice with HN.
Ferrostatin-1 (Fer-1) Reduces Renal Iron Accumulation in Hyperuricemic Nephropathy (HN) Mice: Fer-1 treatment decreased iron accumulation in the kidneys of HN mice, as shown by Prussian blue staining (Fig. 5A&B). Iron levels also decreased significantly. Additionally, Fer-1 upregulated iron metabolism-related factors, increasing mRNA and protein expression of FTL-1 and FTH-1 (Fig. 5C-G), indicating Fer-1's potential in inhibiting renal iron deposition in HN mice.
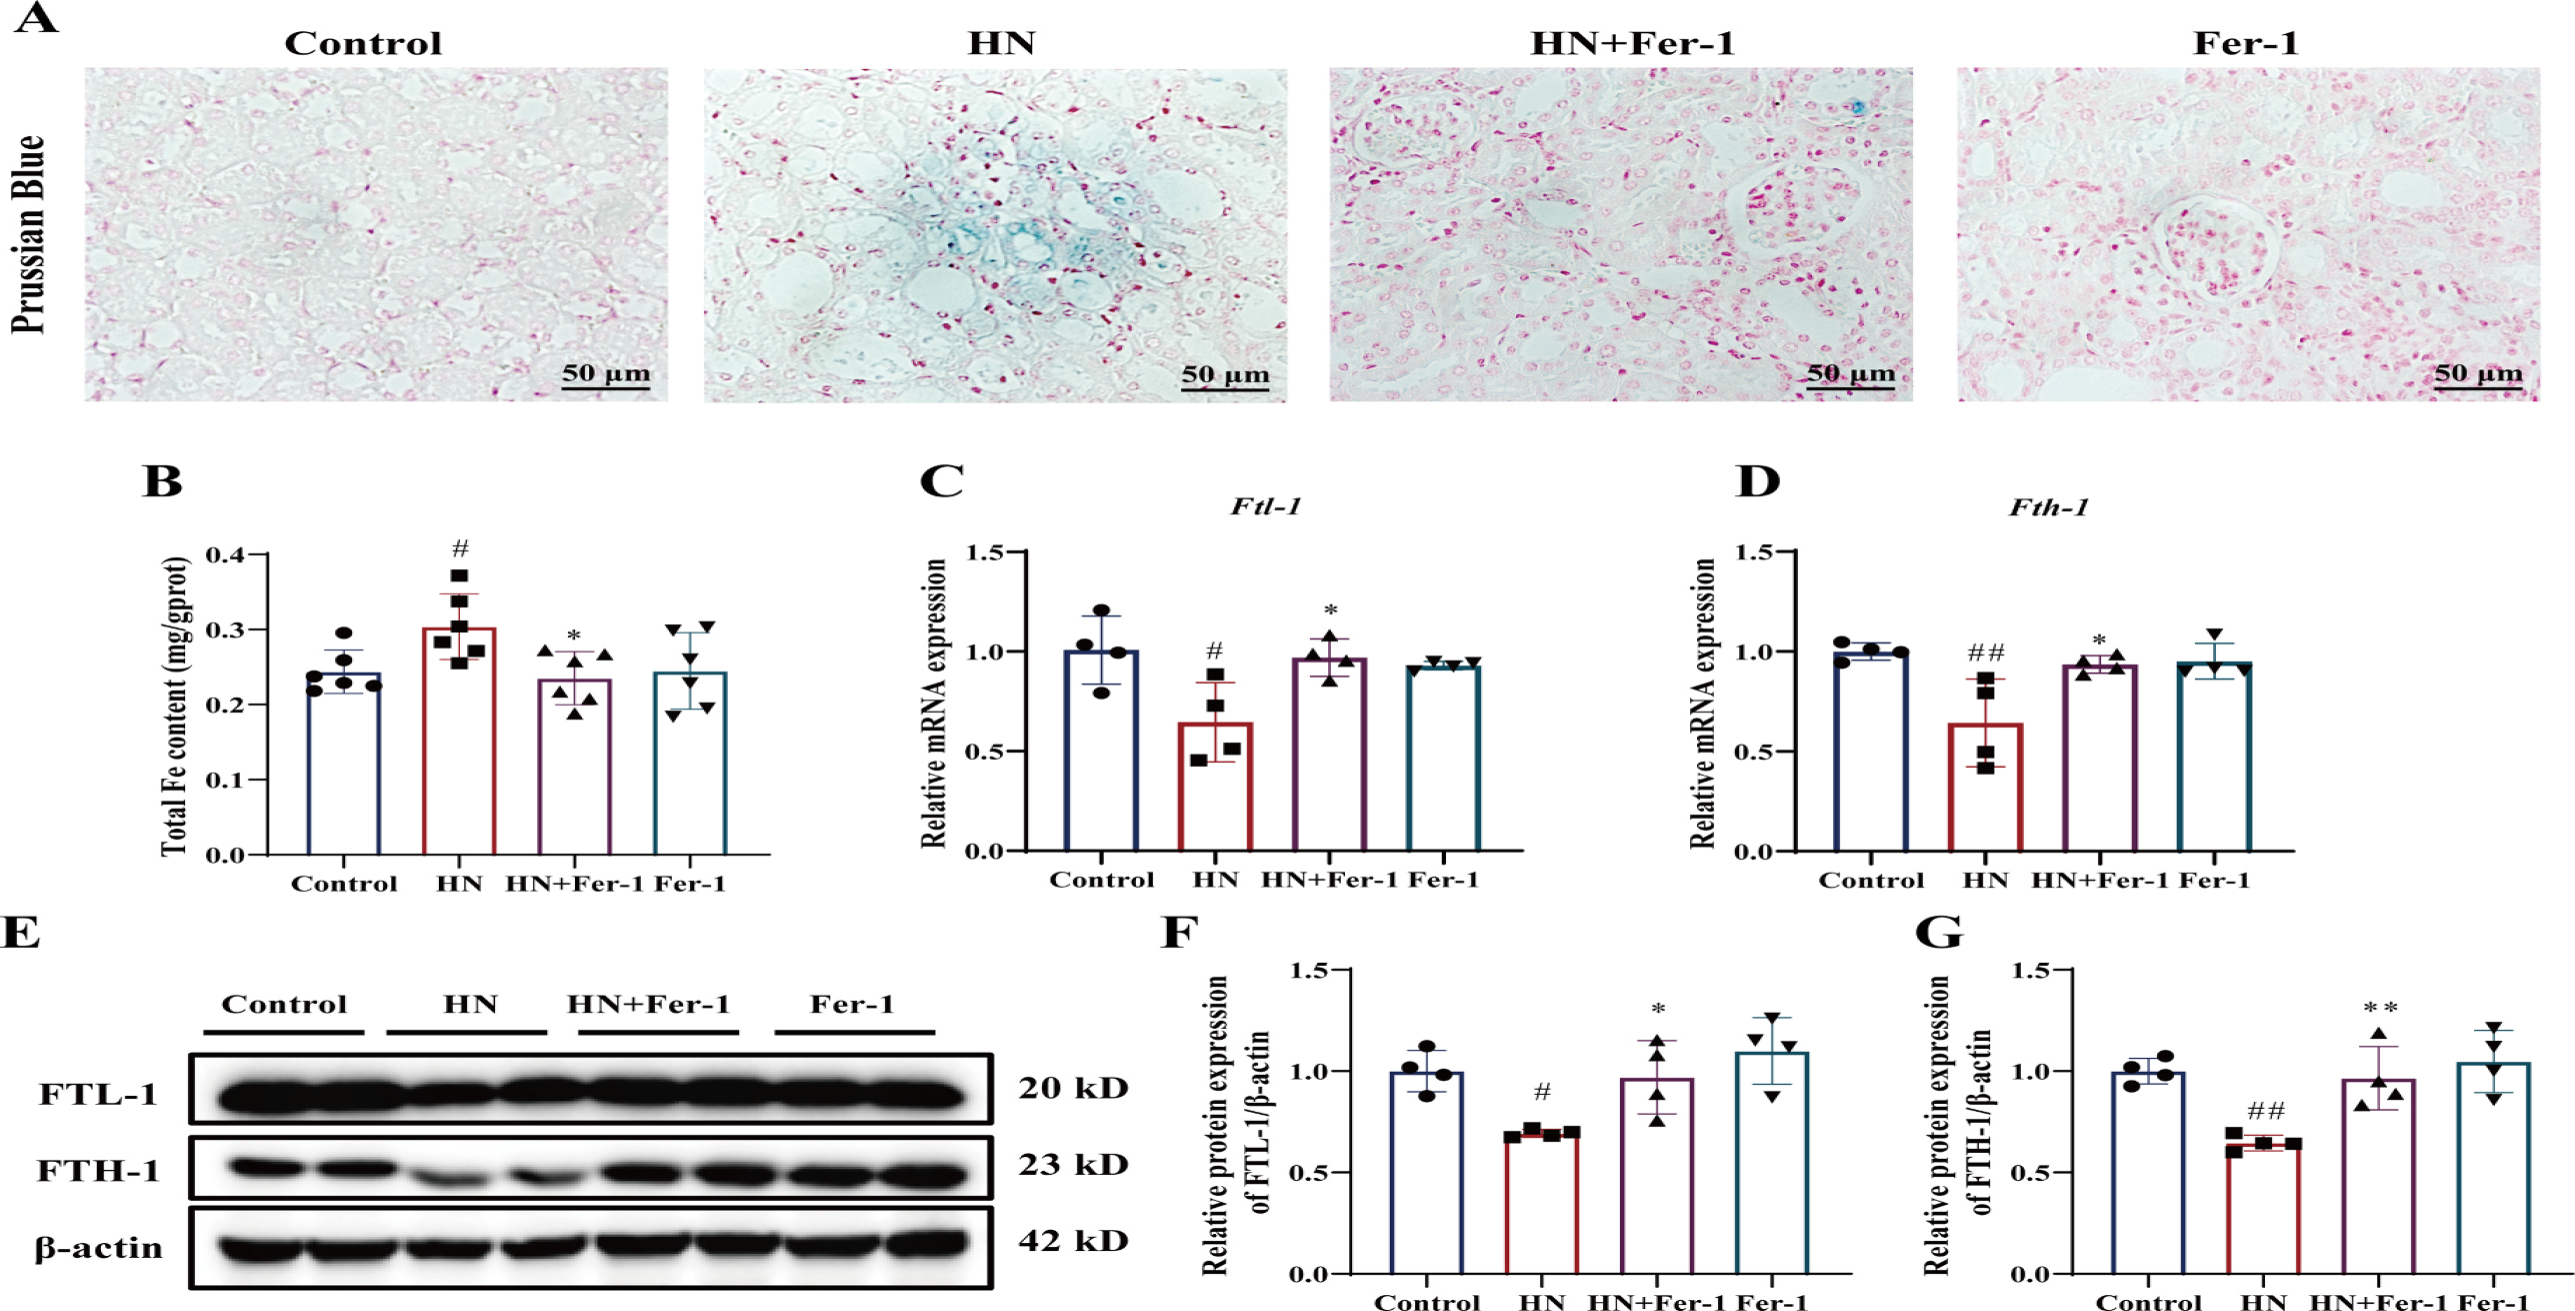
Fig. 5. Effect of Fer-1 on iron metabolism in mice with HN. (A) Representative photomicrographs of Prussian Blue staining of kidney tissues. Scale bar = 50 μm.(B) Total iron content in kidney tissues (n = 6 per group). (C&D) Relative mRNA levels of Ftl-1 and Fth-1 in the kidney tissue. (E–G) The relative protein expression levels of FTL-1 and FTH-1 (n = 4 per group). The data are represented as means ± SD. #p < 0.05, ##p < 0.01 vs. the control group; *p < 0.05, **p < 0.01 vs. the HN group.
Ferrostatin-1 (Fer-1) Attenuates Renal Ferroptosis in Hyperuricemic Nephropathy (HN) Mice: Fer-1 treatment reduced lipid peroxidation in HN mice, evident from decreased malondialdehyde (MDA) levels (Fig. 6A). Fer-1 also increased glutathione (GSH) generation and enhanced superoxide dismutase (SOD) activity (Fig. 6B-C). Additionally, Fer-1 upregulated SLC7A11/GPX4 protein expression (Fig. 6D-F), indicating improved renal ferroptosis through the SLC7A11/GPX4 pathway.
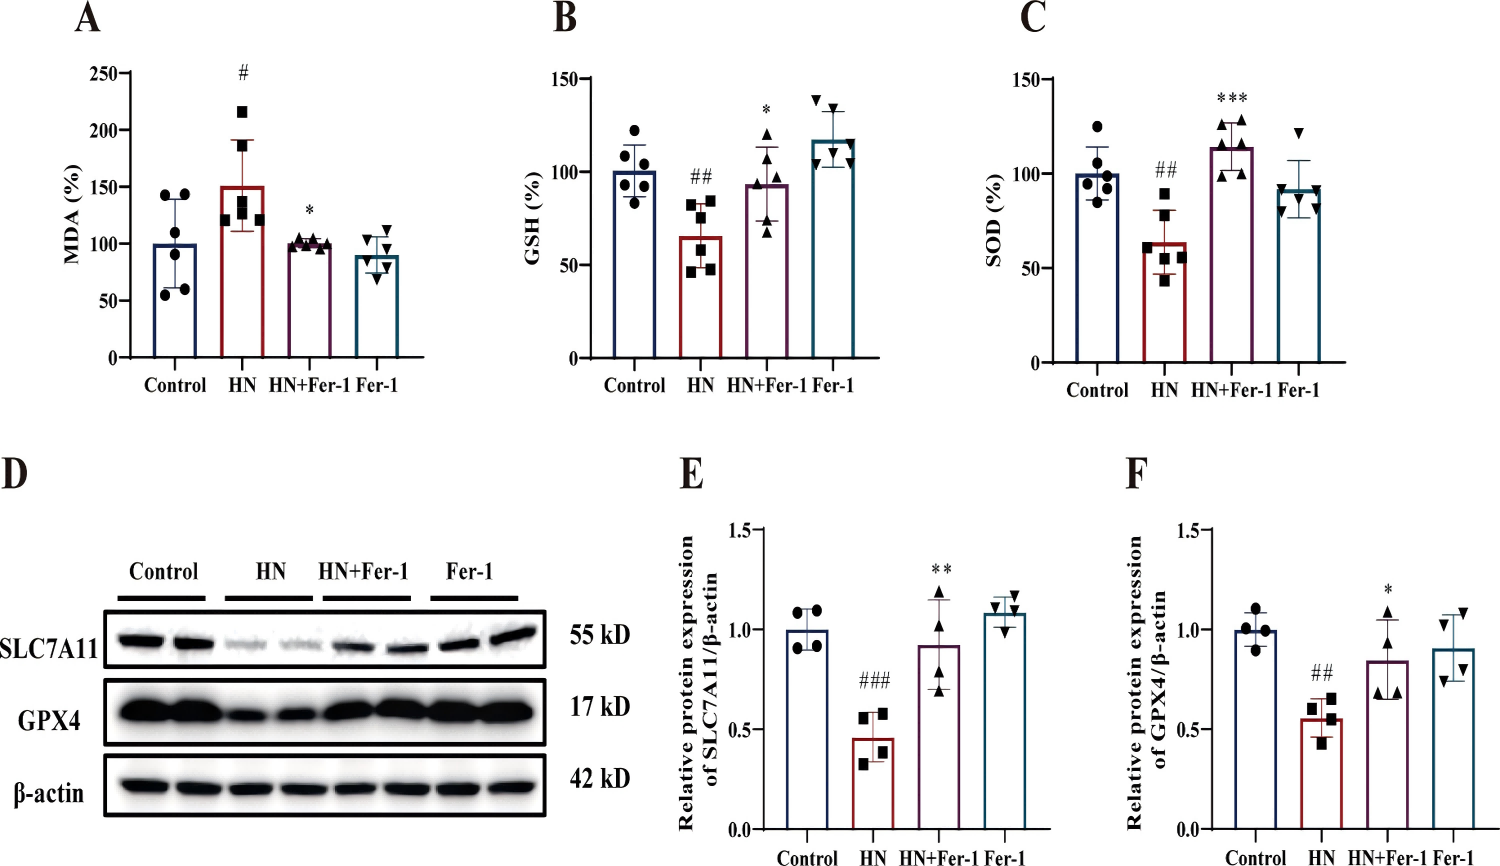
Fig. 6. Effect of Fer-1 on ferroptosis-related molecules in mice with HN. The relative levels of MDA (A), GSH (B) and SOD activity (C) in kidney tissues (n = 6 per group). (D–F) The relative protein expression levels of SLC7A11 and GPX4 (n = 4 per group). The data are represented as means ± SD. #p < 0.05, ##p < 0.01, ###p < 0.001 vs. the control group; *p < 0.05, **p < 0.01, ***p < 0.001 vs. the HN group.
Ferrostatin-1 (Fer-1) Protects HK-2 Cells from High Uric Acid (UA)-Induced Damage: Ferrostatin-1 (Fer-1) safeguarded human kidney tubular cells (HK-2) against uric acid (UA)-induced damage. UA reduced cell viability in a concentration- and time-dependent manner (Fig. 7A). However, Fer-1 (1 μM) treatment significantly enhanced cell viability (Fig. 7B) and decreased lactate dehydrogenase (LDH) release (Fig. 7C) in UA-cultured HK-2 cells. Calcein-AM and propidium iodide (PI) staining revealed increased cell death and labile iron levels in UA-treated cells (Fig. 7D). Conversely, Fer-1 co-administration improved cell viability and reduced damage. These results demonstrate Fer-1's potential in rescuing UA-induced cell death in vitro.
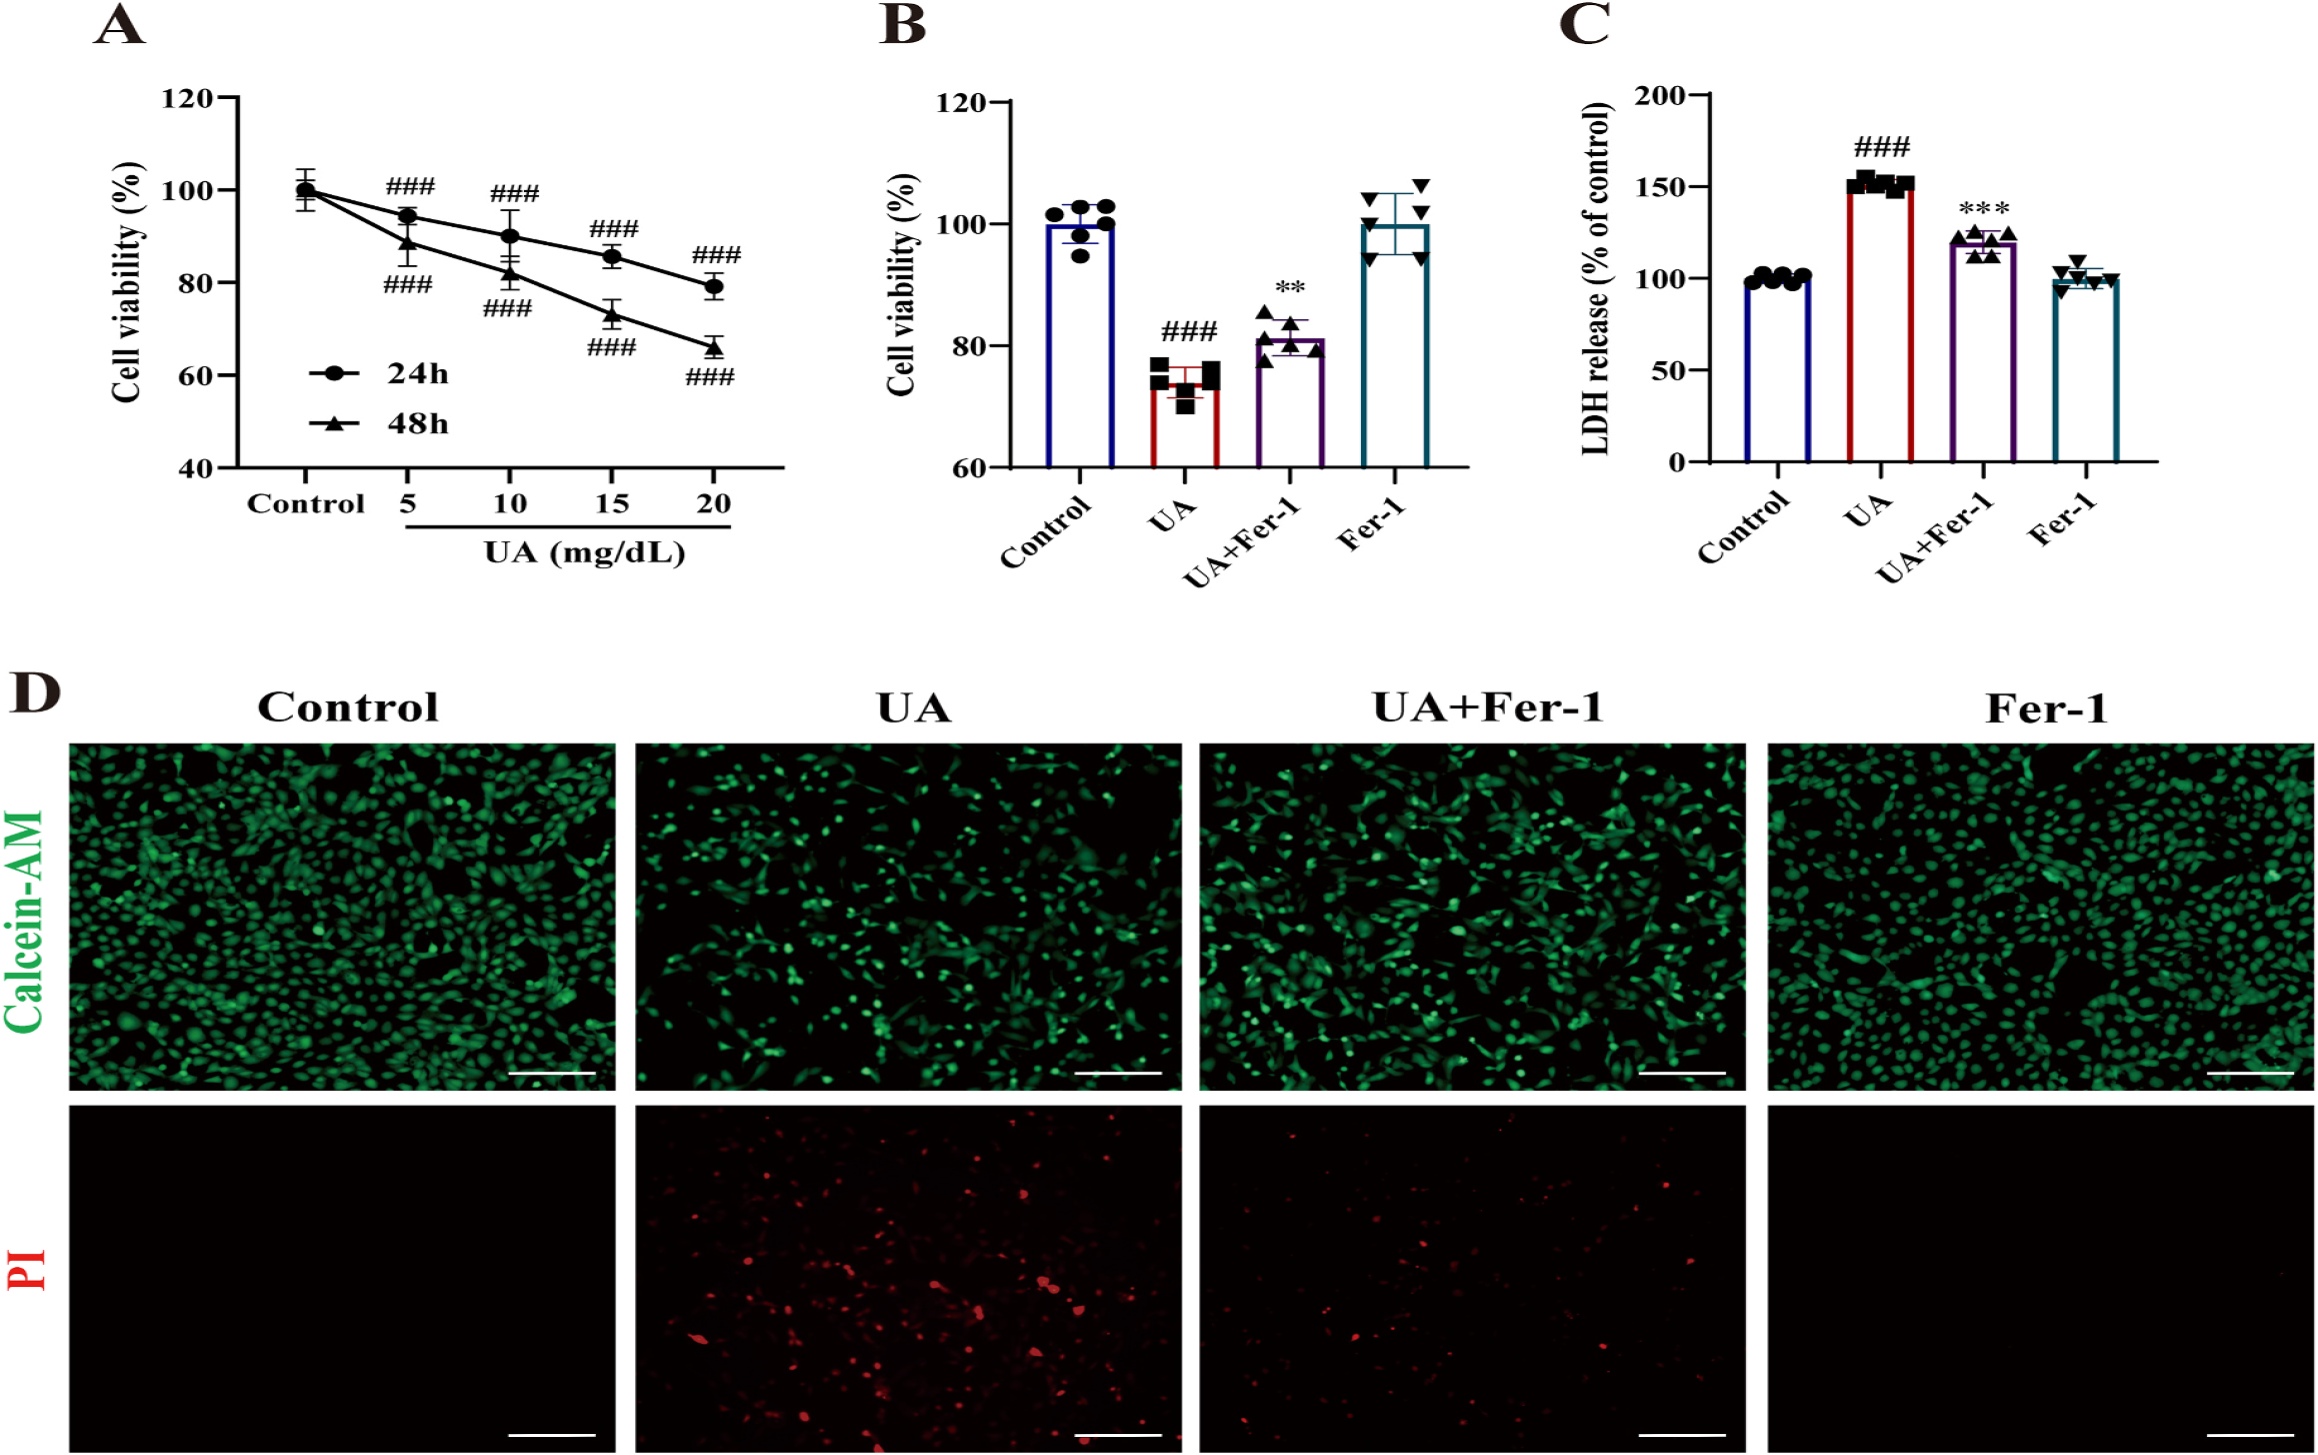
Fig. 7. Effect of Fer-1 on the cell viability in high UA-stimulated HK-2 cells. (A) The cell viability of HK-2 cells after being stimulated with UA (0, 5, 10, 15, 20 mg/ dL) for 24 h and 48 h. The cell viability (B) and LDH release (C) of HK-2 cells after the stimulation with UA (15 mg/dL) in the absence or presence of Fer-1 (1 μM) for 24 h. (D) Representative microscopy images showing living cells and cell death. The upper panel shows Calcein-AM staining for living cells, and the lower panel shows PI staining for dead cells. Scale bar = 20 μm. The data are represented as means ± SD of at least three independent experiments .
Ferrostatin-1 (Fer-1) Regulates Ferroptosis-Related Molecules in High-UA-Induced HK-2 Cells: Fer-1 protected HK-2 cells from high uric acid (UA)-induced ferroptosis by modulating key molecules. UA stimulation increased intracellular reactive oxygen species (ROS) generation (Fig. 8A), malondialdehyde (MDA) levels (Fig. 8B), and decreased glutathione (GSH) levels (Fig. 8C). Fer-1 treatment inhibited ROS and MDA production while elevating GSH content. Additionally, Fer-1 upregulated ferroptosis-related molecules, including SLC7A11, GPX4, FTL-1, and FTH-1, which were downregulated by UA stimulation (Fig. 8D&E). These findings demonstrate Fer-1's protective effects against high-UA-induced ferroptosis in HK-2 cells.
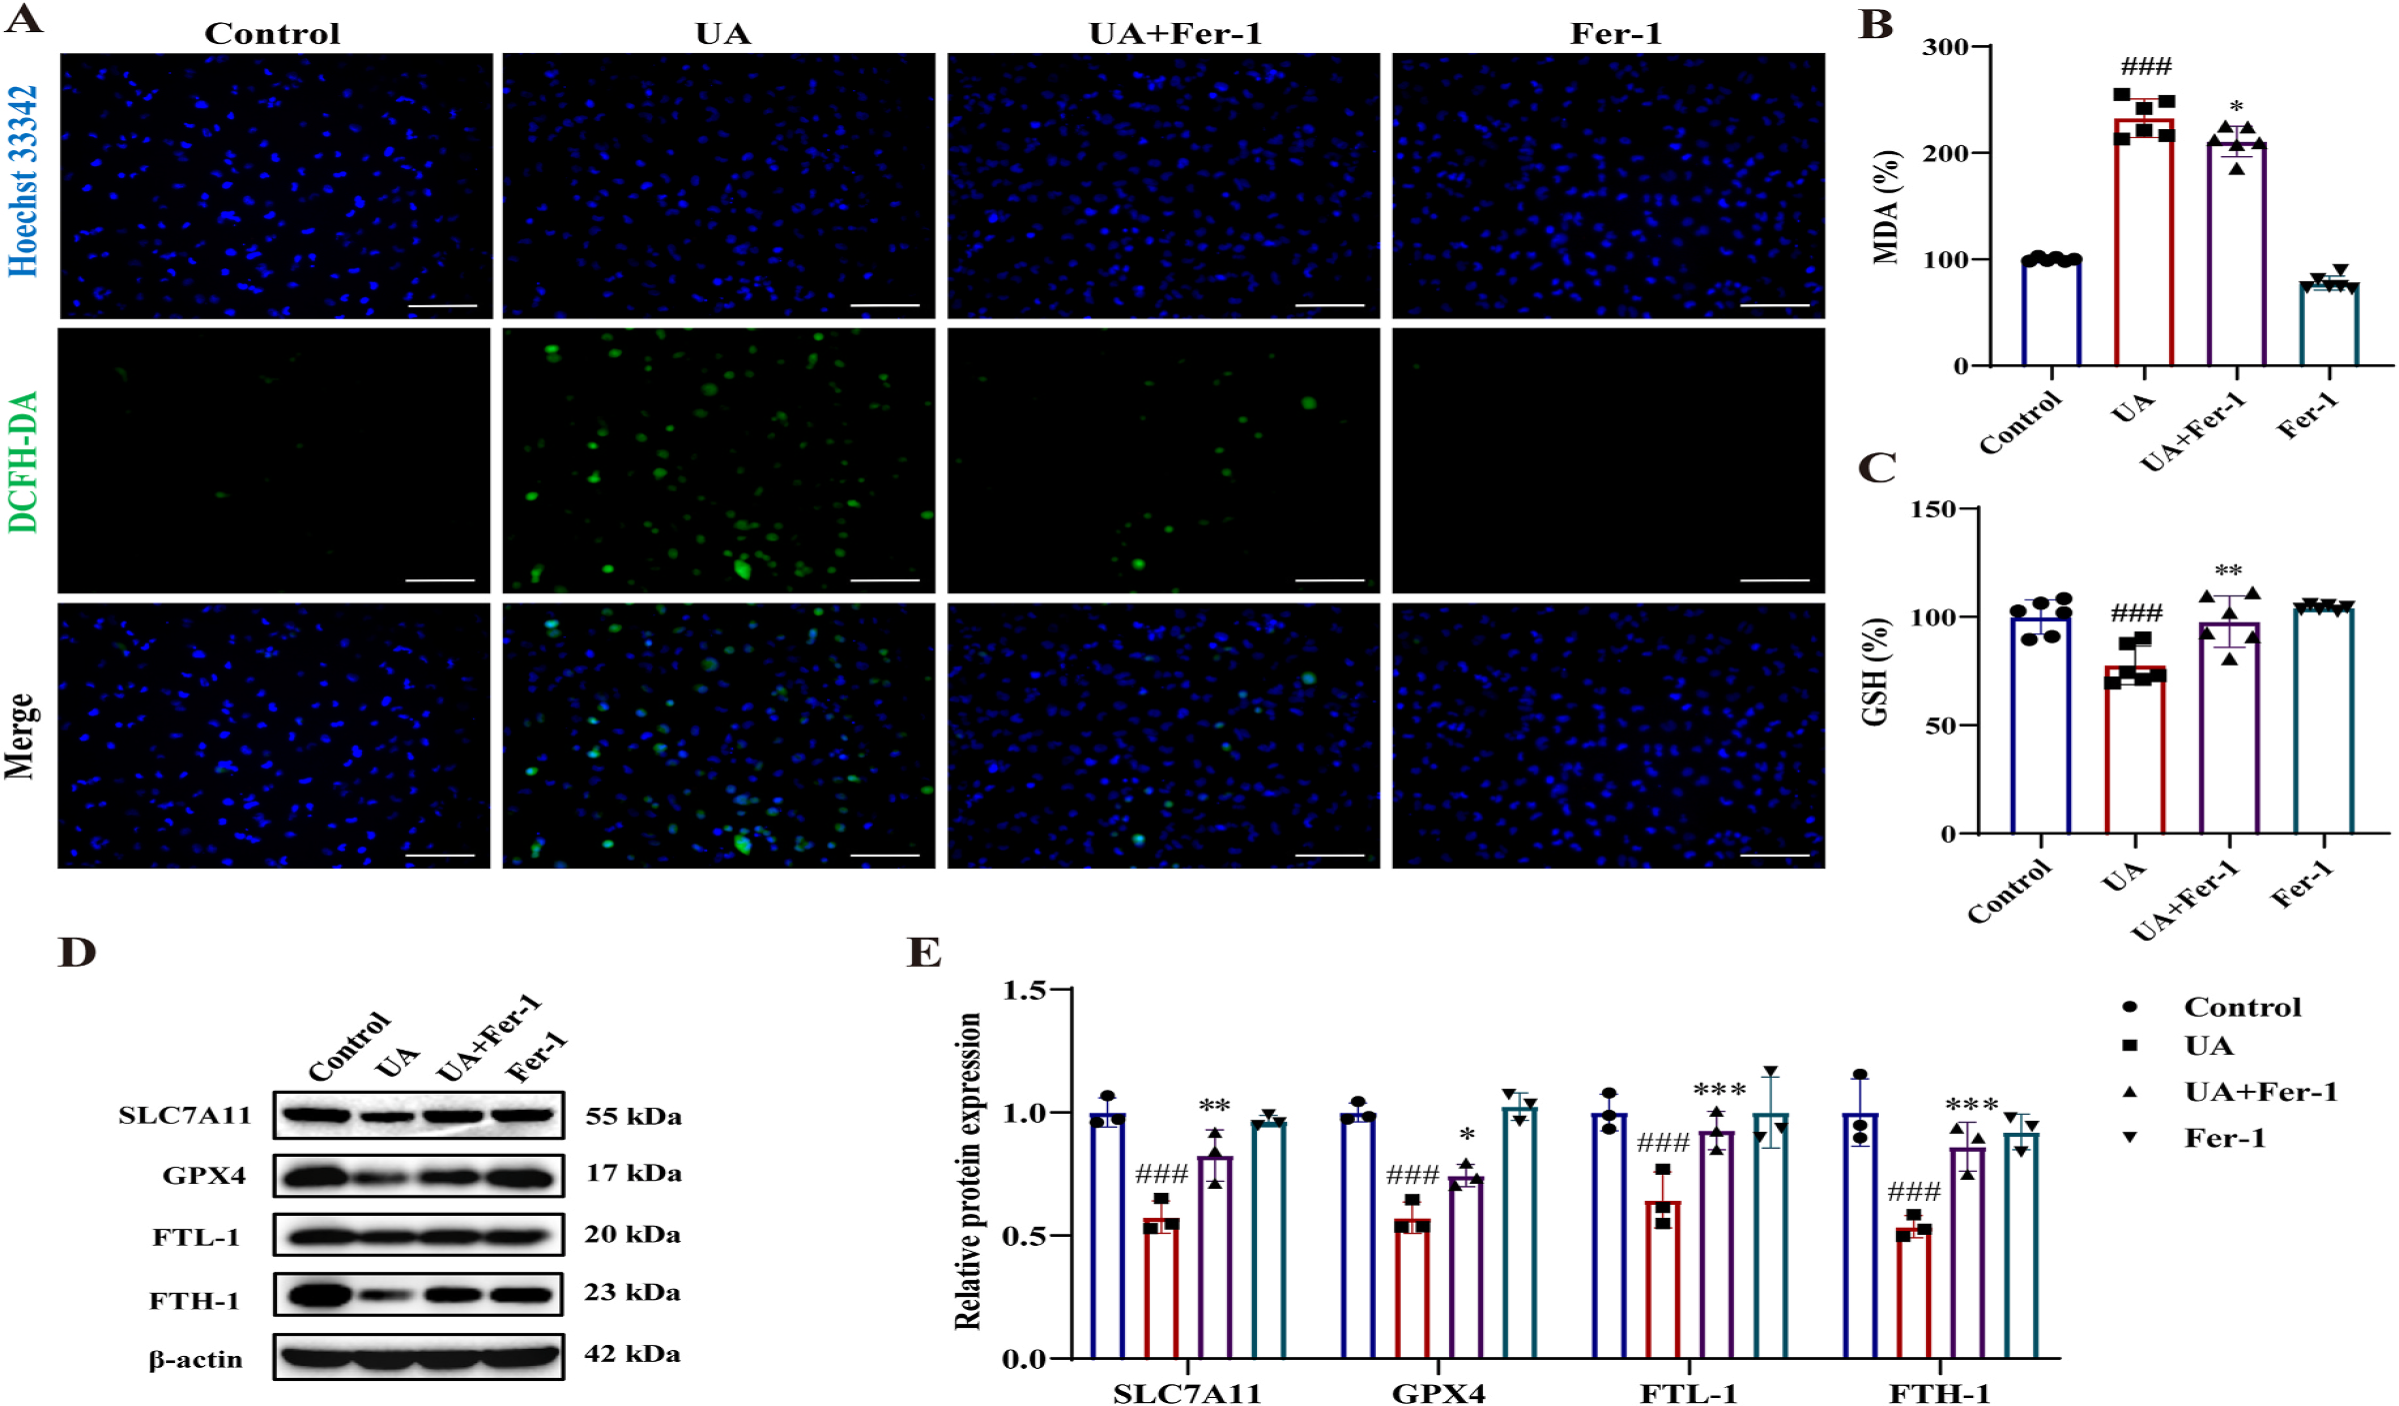
Fig. 8. Effect of Fer-1 on ferroptosis-related changes in high UA-stimulated HK-2 cells. (A) The production of ROS (green), nuclear staining with Hoechst 33342 (blue). Scale bar = 20 μm. (B&C) The relative levels of MDA and GSH (n = 6 per group). (D&E) Immunoblots and the relative protein expression levels of SLC7A11, GPX4, FTL-1 and FTH-1 of HK-2 cells (n = 4 per group). HK-2 cells were stimulated with UA (15 mg/dL) in the absence or presence of Fer-1 (1 μM) for 24 h. The data are represented as means ± SD of at least three independent experiments.
In short, the study identifies ferroptosis as a critical factor in HN progression. Fer-1 shows therapeutic promise by inhibiting ferroptosis and URAT1, providing nephroprotection and urate-lowering effects. These findings pave the way for developing novel treatments for HN.


 Chemical Structure")


Comments